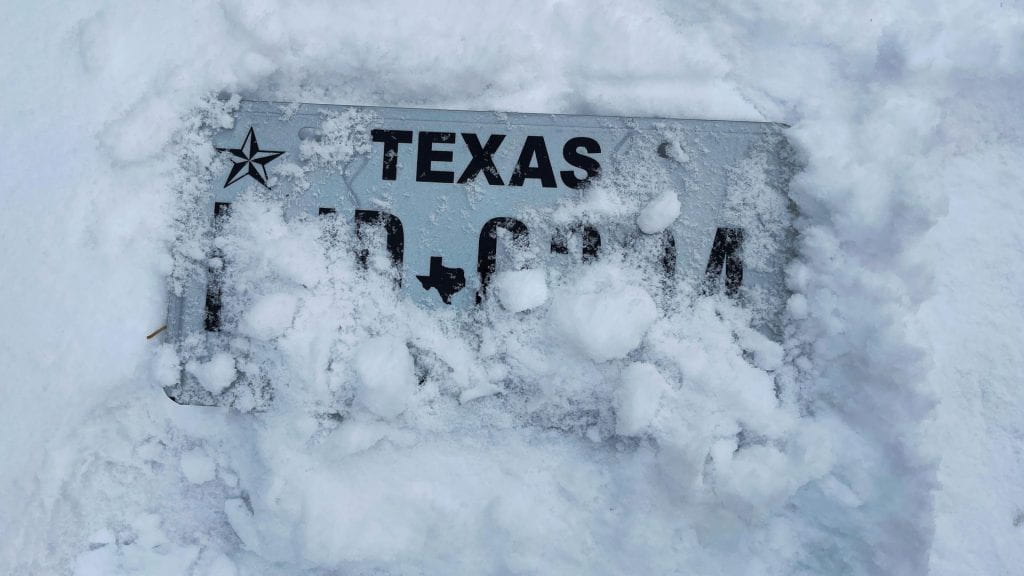
We’re back to talk about the exploits of the Electric Reliability Council of Texas, ERCOT, which, according to a report we discuss here, may have some transparency issues. Last year, Meadows Center’s Robert Mace wrote a piece about ERCOT. Sure, he has lived in Texas most of his life, but what do I know about ERCOT? Thanks to the winter of 2021, the reliability of electric power in Texas is now famous worldwide. There’s the international news and then the sheer number of people affected. February, it was summer vacation in New Zealand, where I was comfortably lounging in my home, when a friend who lives in Maryland called up to share her worries about a relative who was enjoying a few contrasting days of sub-freezing weather enforced by ice-storm-induced power outages in the Dallas-Fort Worth area.

US National Oceanic and Atmospheric Administration satellite images of the Houston area from 2021 on January 31, before electricity outages (left), and on February 16, during storm-induced electric outages (right). Source: KXAN Austin
Fortunately, my friend’s relative in Dallas was more prepared for a catastrophe than ERCOT; circumstances were dire enough that on day three without electricity, she broke down and traded a liter of Canadian Club Whisky for some firewood. Radical times call for radical measures.

In a pinch, trust Canadian Club over ERCOT to keep you warm, mate. Source: AdStasher
Many people may not realize the bullet that was dodged. According to numerous sources, the grid was 4 minutes and 37 seconds away from a “cascading series of events that could have left Texas in the dark for weeks — if not more.” Most of Texas would have been without power, and a so-called “black start” of a dead grid could have taken much longer than “weeks.” No one knows how long it might have taken.
The state of affairs that led to the situation in 2021 could repeat in the future, because ERCOT’s estimations concerning the need for electricity reliability are not anticipating climate variability. Today I provide more detailed information on this topic from the scientific peer-reviewed literature. Much of this literature is only available through costly subscriptions, ironically reducing public access to much publicly funded research. The average person would not find the technical details of the work I discuss in this post easy to follow, so I am attempting to explain in general terms.

And now, for a little scientific data analysis. Source: Dilbert.com
Since the near-total Texas grid failure in 2021, Andrew Dessler, Director of the Texas Center for Climate Studies at Texas A&M University, working with his graduate student Jangho Lee, published a paper detailing their independent analysis on what ERCOT’s estimations of electric demand might have looked like if taking account of climate variability. They first looked at how historical observed data compares to data from climate models for Texas. The scientists found that, in agreement with what we all know and experience, the average daily temperature for winter or summer varies yearly. Importantly, they found that measured temperatures were closely aligned with the average year-on-year variability predicted by the model they used.

This graph plots the average daily temperature for summer across Texas by year (summer being June, July, and August, average temperature includes daily highs and lows). Historical data, because it is observed, is exact, given by the red line. The gold shading shows modeled data expressed as an average, plus or minus some uncertainty. The red line falls consistently in the gold-shaded area and is usually in the middle of the gold shading, indicating excellent agreement between modeled and observed climate data. The green line shows how the general trend is that summer temperatures in Texas have been increasing over the last four decades. Adapted from Lee and Dessler.
Next, concerning temperature and power use in Texas, Lee and Dessler’s findings also confirmed what we sensibly expect: in summer, when temperatures soar, power use increases, and in winter, when temperatures plunge, power use increases, and both in a predictable way.

This graph shows the relationship between temperature and power use in Texas for the summer of 1996 (green) and the summer of 2020 (mustard), summer being June, July, and August. On average, Texans use more power now than in 1996 since so many people live in Texas now. A similar relationship is observed for the winter, only in winter, power use increases as temperatures decrease. Adapted from Lee and Dessler.
Having confirmed their model results against historical data for both temperature and power use, the scientists asked the question—ERCOT forecasts electricity demand and needs for reliability ahead of time—if ERCOT had used a climate model, would the disaster of 2021 have been foreseeable? The table below tells the story. ERCOT’s predictions and those of Lee and Dessler agree very well, to within 5% at worst, for the “normal” case. For extreme events, ERCOT’s forecasts were low, way too low.
|
ERCOT Calculations |
Lee and Dessler Calculations |
Agreement / Difference |
|
| Summer 2021, most likely seasonal maximum demand: | 77 GigaWatt | 77.5 GigaWatt | 0.6 % higher |
| Winter 2021, most likely seasonal maximum demand: | 57 GigaWatt | 60 GigaWatt | 5 % higher |
| Chance of “extreme” scenario, summer | 10 % | 17 % | 70 % higher |
| Chance of “extreme” scenario, winter | 10 % | 19 % | 90 % higher |
Texas has always been known for extreme weather. In their conclusions, Lee and Dessler point out the importance of recognizing climate variability in ensuring that the electric power needs of Texas can be reliably met. Several times in their paper, the authors pointed out how they cannot reproduce ERCOT’s estimates, as ERCOT does not provide sufficient information about how they perform their estimates. While the authors reported that ERCOT disputes some of their findings, ERCOT did not predict the potential extreme power needs of winter 2021, whereas the Lee and Dessler study did. ERCOT has not released the technical details of how they obtain their results, whereas Lee and Dessler’s results passed peer review. Lee and Dessler close their paper by calling for ERCOT to make their forecast model public and transparent. It seems reasonable. What are your thoughts? Is that asking too much? Let us know what you think in the comments →
Good article, but is it reasonable to expect that ERCOT would be transparent when every other aspect of state gummint is opaque? Railroad Commission? Governor’s office? Attorney General? Please.
Who benefitted from the snowpocalypse? Natural gas purveyors, to the tune of billions. (Who, in turn, donate mere millions to “our” leaders.)
These agencies are opaque because they are corrupt. They are corrupt because we have had one party rule for 25 years.
Hey – sorry to be delayed in getting back to you. Thanks for your input about the article, for reading and commenting. I am recently moved here. Interested to see if anyone else will reply.
Both ERCOT and L&D calculated a less than 20% chance of an extreme winter scenario. I believe that reflects a greater than 80% likelihood of a non-extreme scenario. This begs the question what is the definition of an “extreme scenario” in this study, and what likelihood should trigger preparing for the extreme? And, what should preparation look like?
So many interesting facets to your comments. The article itself did go into detail on probabilities, not captured when summarized for general readership. It is difficult, as a prior Habanero post points out: even for probabilities of 0%, 100%, many people think this could still mean greater than zero or less than 100 (https://jalapeno.wp.txstate.edu/2022/12/02/what-are-the-odds/). Friends in the business of electric supply tell me that the ever-increasing difficulty is planning for extremes with very low probability. I lived in a house with no electricity for a while when I was young, lived in the tropics with no ac, lived in the far north with only a small wood stove (hard to start a fire when you arrive home to a stove at negative 20 deg F), and have lived places where having the electricity fail almost daily for 1-12+ hours a day is normal. It’s not that big a deal when one is used to it, but 2021 was a shock by applicable cultural norms. I cannot think of an alternative to preparing for rare extremes, other than preparing for and accepting outages during rare extremes? Would that be a measured approach, or would you have a different idea on that?