I know someone in public relations; she avoids topics such as religion, politics, and the weather. Religion and politics can be very personal and areas of possible dissent. Talking about the weather, she tells me, might seem safe, but might in its safety bore the very people that she wants to engage. Perhaps things are changing. The weather in some parts of the world seems increasingly destructive and hard to avoid talking about.
There is a difference between weather and climate; however, some related aspects on the topic of HEAT can be easy to overlook (more on this below). When we talk about climate or weather, we often use the same terms: temperature—hot or cold? humidity—muggy or not? precipitation—rainy or not? etc. Long-term weather patterns divide the world into regions constituting climates: tropical (hot and humid weather), dry (deserts, little rain), temperate (warm summers, mild winters), continental (warmish summers, very cold winters), and polar (the weather is even cold in the summer).

The five main types of climates. Source: NOAA
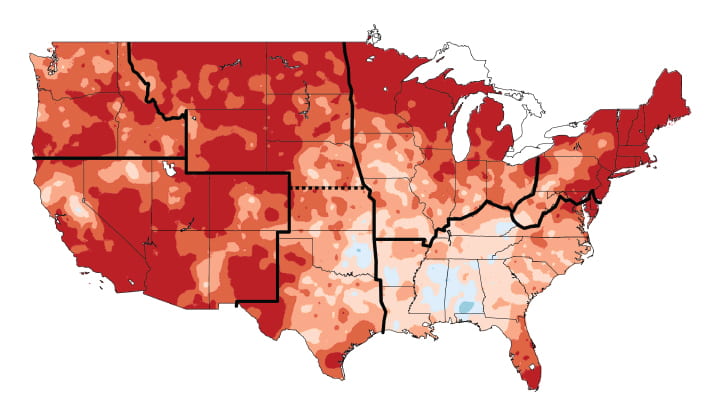
It is the variability of the weather that makes it comment-worthy to some. If the weather varies, is it not logical that the climate also does? The graphic below demonstrates this theme of variability and illustrates changes in temperature in the U.S. in recent decades:

Source: NASA Earth Observatory
The colors on the map show observed temperature changes over 1991–2012 compared to the 1901–1960 average. The period from 2001–2012 was warmer than any previous decade for each region outlined by the solid black lines on the map. While the southeast region is warmer overall, southern Alabama has been just a smidge cooler. According to the labels on the figure, cooler means up to 1.5 °F cooler. It is hard to believe that anyone would be reaching for the remote to turn their air conditioner off during an Alabama summer at that rate of cooling. This is why we should be discussing HEAT!!
In science, the term sensible heat refers to, at its simplest, the heat that you can feel. It is also the primary form of heat stored within the surface layer of the world’s oceans, which are the source of most weather patterns and all hurricanes. The ocean is feeling the heat. The graph below shows the seasonal (three-month) heat energy in the top half-mile of the ocean compared to the 1955–2006 average. The heat content in the global ocean has been going up (and up and up) since the mid-1990s. Specifically, more than 90 percent of the excess heat trapped in the Earth system from the small temperature changes discussed above has been absorbed by the oceans. Over 1022 Joules of heat every three months and counting.

Heat content in the global ocean has been consistently above-average (red bars) since the mid-1990s. Note this data is from actual measurements around the globe, not predictions or models. Source: NOAA Climate.gov
The amount of heat shown for the most recent measurement in the figure above (20 x 1022 Joules) is approximately 55,000,000,000,000,000 kilowatt-hours. (For reference, a kilowatt-hour is a measurement of how much energy is used — you typically see this measurement on your electricity bill.) So, that little change in temperature that seems hardly worth talking about looks different when viewed in terms of heat energy. It is difficult to express how much heat this is, or what the consequences are.
We can view this in terms of chili peppers. We renamed this blog from Hotter than a Jalapeño to Hotter than a Habanero because a jalapeño is simply not very hot. Chili pepper “heat” is measured on the Scoville scale. In terms of Scoville heat levels, your jalapeño averages between three to six, “mild-hot,” whereas your average habanero is a level ten, “very hot.” In terms of the heat content, that is, active ingredient, chili-wise, it is not really linear. The heat level of a habanero is higher than that of a jalapeño by around two or three (goes up a little, more like temperature), but in terms of heat content, a habanero is more than 100 times hotter than a jalapeño (goes up a lot, more like heat).
The comparison of temperature versus heat is a little like this jalapeño versus habanero, but more extreme, nearly a million billion times more extreme. On the Scoville scale, a chili with as much heat as the oceans today, compared to recent history, does not exist. If a chili hot enough to meet such a comparison did exist, it would be instantaneously lethal.
We humans are not great at taking in and processing such big numbers; maybe someone will attempt a blog post on this at a future date. Meanwhile, if you view the discussion in terms of heat instead of temperature, does this change your thinking about climate and how climate science should be communicated? Let us know in the comments →
This article is a shortened adaptation of a more detailed article that can be found here.
*Thank you to Paul Bertetti for catching an error we initially missed when this article was posted on December 14, 2022!
Additional Resources:
- Climate FAQs (USGS)
- Climate Kids (NASA)
- Climate Maps (NOAA)
- National Forecast Maps (NWS)
- National Weather Service (NWS)
- What’s the Difference Between Weather and Climate? (NASA)
- What’s the Difference Between Weather and Climate? (NCEI)
- Chili Pepper Scoville Scale (Scoville Scale)
- Climate Change: Ocean Heat Content (NOAA)
Lesson Plans:
You may want to double check your unit conversions. It seems that 1 Joule is 2.78e-7 kilowatt-hours. And 55e15 KWH would be 2e23 Joules